|
Getting your Trinity Audio player ready...
|
Insurance runs on seemingly endless amounts of information, whether it’s policy histories, claims records, customer interactions, compliance documentation or financial reporting. Unfortunately, having lots of it is not the same as being able to use it.
In many insurance environments, teams need to export data from core systems, move it into Excel, apply formulas, reconcile numbers, and then distribute reports to executives or department leaders. It’s tedious, especially if you’re doing it month after month after month, and it’s also prone to errors. The result is an organization that is simultaneously data-rich and insight-poor.
As insurance firms start to turn toward AI to help reduce manual labour and speed up workflows, the hard truth is this: their data foundation simply isn’t ready to support the modern analytics and insights they are looking for. And that is a genuine strategic liability.
However, Power BI and Microsoft Fabric can address that challenge directly. Together they give insurance organizations a way to take fragmented data and turn it into reporting and analytics that people can actually trust.
Data Needs in the Insurance Industry
Before thinking about platforms and architecture, it helps to be clear about what insurance organizations are actually trying to do with their data. The use cases span the full business:
Underwriting and Risk Assessment
Underwriters need to evaluate risk accurately and price it appropriately. That requires combining internal data, like policy history, prior claims, etc., with external sources like climate risk models or credit information. The more accurate that picture is, the better the underwriting decision. When it is fragmented, pricing suffers and the potential for risk grows.
Claims Processing and Fraud Detection
Claims generate large volumes of data quickly, and the ability to move fast while making good decisions depends on having that data organized and accessible. Insurance companies also need to be able to spot patterns that suggest fraud, flagging claims likely to escalate costs.
Customer and Policy Data
Insurance is a relationship business, but most insurers do not have a unified view of the customer relationship. A customer might hold multiple policies across different lines of business, have a multi-year claims history, and interact with the organization through brokers, call centres, and digital channels. Bringing that data together is a must for better retention strategies and understanding the customer journey.
Compliance and Governance
Insurance is a regulated industry. Data governance is not optional; it’s a legal and regulatory requirement. Organizations need to demonstrate what data they hold, how it is used, who has access to it, and how long it is retained. As AI tools enter the picture, the governance requirements around transparency grow more demanding, not less.
It’s no wonder insurance companies are eyeballing AI to help sift through the all the data.
Data Trust Comes First
The conversation about AI in insurance often skips a step. When organizations start to think about how to implement AI in all the above use cases for better outputs, it’s easy to understand the appeal. The problem is that advanced AI tools do not create good data. They depend on it as an input.
PwC Canada has found that only 37% of Canadian financial services leaders say they have a clearly defined AI roadmap, and only 43% say they have formalized responsible AI and risk processes in place. Those numbers are not surprising when you consider how many organizations are still working through the fundamentals of data consolidation and reporting reliability.
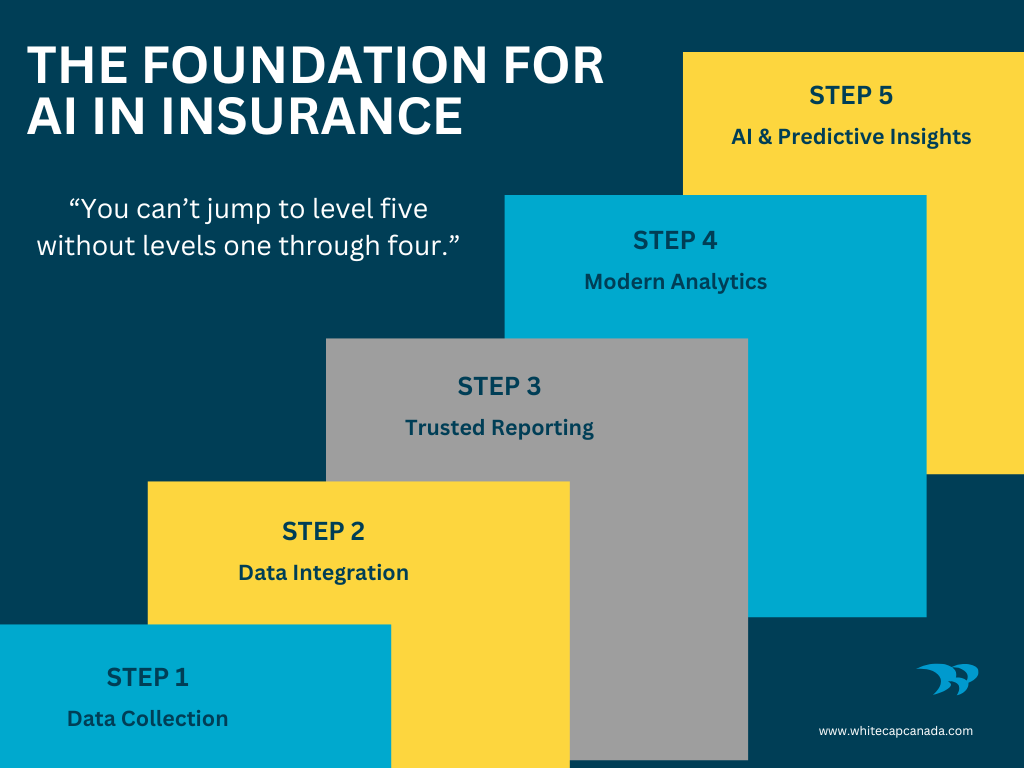
Daryl Yanga, a senior analytics consultant at Whitecap who has worked across multiple insurance engagements, describes it this way: “You can’t jump to level five without having levels one through four in place. Make sure the foundation is sound — the data architecture, the governance, the reporting that people actually trust — and then you can start thinking about AI and what comes next.”
The practical implication is that the right starting point is almost never the most ambitious use case. When Whitecap starts an analytics engagement with an insurance client, the first question asked is, “What reporting matters most to the business right now?” The answer is almost always the same: sales and finance.
Common reporting needs include revenue, renewals, new business, retention, policy-in-force data, lost business, accounts receivable, income statements, profit and loss reporting, and other executive-level metrics.
These are an essential priority. The reports help leaders answer crucial questions: How is the business performing? Where is revenue coming from? What is being renewed? What is being lost? Where are the trends moving?
Lawrie Insurance Group, a client of Whitecap’s, was spending 10 business days each month just to produce its executive reports. What they needed was a way to automate the reporting process so the data refreshed continuously and the numbers were always ready when needed. That is what a successful foundation looks like. One that creates real confidence in the data. Learn more about how we helped Lawrie reduce the time it takes to generate their monthly reports by 50%.
Where Microsoft Fabric and Power BI Fit In
Microsoft Fabric and Power BI work together to help insurers move beyond static reporting and disconnected spreadsheets.
Power BI is the reporting and visualization layer. It turns data into dashboards, reports, charts, and interactive views that business users can understand and use. For insurance teams, this might include total production dashboards, new business, cancellations and renewal tracking, and retention analysis.
Microsoft Fabric provides the broader data foundation underneath. It brings together capabilities for data, transformation, storage, engineering, analytics, and governance. OneLake, Fabric’s unified data lake, helps organizations create a shared foundation for analytics data across the business.
Most insurance companies use Applied Epic, a cloud-based agency management system (AMS) designed specifically for independent insurance agencies and brokerages. In a typical Applied Epic environment, data is entered and managed inside Epic first. That might include policy activity, premium transactions, production data, cancellations, renewals, or finance-related information. From there, Fabric can connect to the Epic data lake, copy the relevant data into a Fabric lakehouse on a scheduled basis, and prepare it for reporting in Power BI.
So now, the reporting no longer depends on someone exporting data from Epic, moving it into Excel, applying formulas, and manually rebuilding the same reports each month. Instead, the data needed for sales, production, renewal, retention, and finance reporting can be pulled into a more structured analytics environment, where the logic is standardized and the reports refresh more consistently.
This does not mean replacing Applied Epic. Epic can remain the operational system where teams manage day-to-day insurance data. However, Fabric and Power BI sit around that environment, giving insurers a more flexible way to manage reporting, preserve historical data, combine Epic data with other sources, and build toward more advanced analytics over time.
Comparison: Applied Epic Dashboards vs. Microsoft Fabric and Power BI
For brokerages already using Applied Epic, it is worth being clear about where Epic’s own dashboard functionality fits in and where it runs out.
|
Feature |
Applied Epic Dashboards | Microsoft Fabric + Power BI |
| Primary Purpose | Embedded dashboard views within the Applied Epic ecosystem | Broader analytics platform for integrating, modelling, governing, and visualizing data |
| Setup & Maintenance | Out-of-the-box dashboards designed for faster setup within Epic | Custom-built environment that requires IT/data teams to extract, transform and map data from Epic to a data lake |
| Data Scope | Strictly limited to the data housed in Applied Epic | Limitless: Consolidates Epic data with other systems: finance platforms, CRM, HR/benefits systems, carrier portals, and external data sources |
| Visualization & Customization | Standardized, persona-based views (Account Managers, Producers, Claims, etc.) with limited drill-down formatting | Highly customizable dashboards, KPIs, data models, and interactive reports |
| Data Foundation | Uses Applied’s standard reporting infrastructure | Uses Fabric (OneLake & Data Factory) to act as a massive, unified data engine for analytics, AI and complex data governance |
| Cost Profile | Included with Applied Epic license footprint (may require specific add-ons or user tiers) | Requires Microsoft Fabric licensing + Power BI Premium/Pro |
Applied Epic Dashboards are useful for operational reporting directly within Epic. Microsoft Fabric and Power BI provide broader analytics capabilities, including cross-system reporting, historical trend analysis, data governance, and AI-ready data architecture for insurance organizations.
The right choice depends on the organization’s needs. Epic Dashboards may be enough for teams that want immediate visibility into their Applied Epic data. Fabric and Power BI become more valuable when reporting needs are more complex, when data lives in multiple places due to mergers and acquisitions, or when the organization wants a stronger foundation for advanced analytics over time.
Quick Insurance FAQ
Q: What is Microsoft Fabric and how does it help insurance companies?
A: Microsoft Fabric is a unified data and analytics platform that helps insurance companies bring together data from multiple systems into a single, governed environment. It combines data integration, storage, engineering, analytics, and reporting capabilities in one platform. For insurers, this can reduce reliance on manual spreadsheets, improve reporting accuracy, and create a stronger foundation for AI and advanced analytics.
Q: How is Power BI used in the insurance industry?
A: Power BI helps insurance companies turn operational and financial data into interactive dashboards and reports. Common use cases include policy and premium reporting, renewal tracking, retention analysis, claims monitoring, sales performance reporting, and executive dashboards. By automating reporting, Power BI helps insurance teams spend less time preparing data and more time making decisions.
Q: Can Power BI connect to Applied Epic?
A: Yes, Power BI can be used with data from Applied Epic. Many insurance brokerages use Microsoft Fabric or other data integration tools to extract and prepare Applied Epic data for reporting in Power BI. This allows organizations to automate reporting, preserve historical data, and combine Epic data with information from other business systems.
Q: What are the biggest data challenges facing insurance companies?
A: Common insurance industry data challenges include fragmented systems, manual reporting processes, inconsistent data quality, and limited visibility across customers, policies, and claims. These issues can slow decision-making, increase reporting effort, and make it more difficult to implement AI and advanced analytics initiatives successfully.
Q: Is Microsoft Fabric a replacement for Applied Epic?
A: No, Microsoft Fabric is not intended to replace Applied Epic. Applied Epic remains the operational system for managing policies, customers, and insurance transactions. Microsoft Fabric complements Epic by creating a centralized analytics environment where data can be consolidated, governed, and prepared for reporting and analysis.
Q: Why is data governance important for insurance organizations?
A: Data governance helps insurance organizations maintain data quality, security, compliance, and accountability. Regulatory requirements often require insurers to demonstrate how data is collected, stored, accessed, and retained. Strong governance also improves trust in reporting and helps support future AI initiatives.
Q: Can insurance companies use Microsoft Fabric and Power BI for AI initiatives?
A: Yes, Microsoft Fabric and Power BI can help prepare insurance data for AI and machine learning initiatives. Before AI can deliver reliable insights, organizations need clean, connected, and well-governed data. Fabric helps create that foundation by bringing data together, while Power BI helps organizations understand and trust the information being used.
Q: What are the benefits of modern analytics for insurance companies?
A: Modern analytics helps insurance companies improve reporting accuracy, reduce manual work, increase visibility into business performance, and make faster decisions. It also creates the data foundation needed for more advanced capabilities such as predictive analytics, fraud detection, forecasting, and AI-driven insights.
Start with What Matters Most
Insurance organizations do not need to modernize everything at once. A more practical approach is to start with a high-value reporting area, prove the model, and expand from there.
For many insurers, that first area is probably sales or finance. For others, it may be claims or underwriting. The important part is to choose a use case that matters to the business, connect the right data, validate the logic, and build reporting that people trust.
That is where Microsoft Fabric and Power BI can create meaningful value. It’s a powerful platform that helps insurers move away from manual reporting and toward a more governed, automated analytics environment. From there, the path to advanced analytics becomes much more realistic.
If you are evaluating how to move beyond manual reporting and create a more connected, future-ready data environment, Whitecap’s Microsoft Fabric service can help you turn data into a true business advantage. Let’s talk!