|
Getting your Trinity Audio player ready...
|
Imagine a vault overflowing with treasure but, there’s a catch: it’s locked, and the key is scattered in a thousand pieces. That’s the data dilemma facing companies today. We drown in information yet struggle to extract actionable insights. In fact, IDC says that the average business is expected to manage 50 times more data by 2025 than it does today.
The good news? Power BI, now integrated with Microsoft Fabric, is poised to change the game. Packed with AI-powered tools, it’s ready to unlock the hidden value in your data silos.
Buckle up, because we’re about to delve into the exciting world of data-driven insights. Ready to unlock the true potential of your data? Let’s dig in!
What Is Microsoft Fabric? (And Why is Power BI Moving There?)
First things first, let’s be clear that Microsoft Fabric is not replacing Power BI. Instead, Microsoft Fabric is the new home for Power BI, and it acts as an end-to-end analytics platform that centralizes all the data and analytics tools. Fabric brings together technologies like Azure Data Factory, Azure Synapse Analytics, and Power BI into a single unified solution. It supports data flows, data science, business analytics and real-time analytics in a very rich and comprehensive way. Fabric can best be thought of as a more holistic, flexible and scalable solution for gathering, managing and analyzing data.
The move makes data pipeline and lakehouse activities easier and more widely available as well as simplifies data management by removing the need to piece together services from different vendors. Microsoft explains it this way, “Microsoft Fabric was built to help foster a data culture—enabling anyone to quickly go from data sitting in a lake to stunning Power BI visuals embedded in a Microsoft 365 app.”
What Does It Mean for You?
Microsoft Fabric acts as the underlying platform that enhances Power BI’s capabilities. If you were using Power BI before, you just got a whole bunch more to explore with its integration into Fabric. And there are a ton of benefits for you and your organization.
- It democratizes data. You don’t need to apply or understand every individual service. Instead, you simply log into a single platform and dive right into data analysis.
- It eliminates data siloes. Acting like a single-source-of-truth, Fabric consolidates data from disparate sources, ensuring data integrity and consistency across your business.
- It’s easy to use. Power BI teamed up with Fabric brings a DIY dynamic to less complex data projects for personal use or small teams. Be aware that citizen development is not without its risks and requires good governance. Learn more about the challenges and opportunities of citizen development here.
- It’s affordable. No need to go the expense of building your own database and data warehouse, Fabric offers a variety of reasonable “pay as you go” solutions. It’s plug-and-play, and as a SaaS solution, everything just works.
- More power! Power BI was always great, but now within the framework of Fabric, you can do more and get very robust results.
AI Features You Need to Be Using Now
The new Microsoft Fabric with Power BI reveals some cool new AI integrations. Here are some of our favourites.
Automated Machine Learning (AutoML)
Machine learning is a type of AI that uses data sets and algorithms to imitate the way humans learn. It leverages historical data to predict new scenarios and make decisions based on that information. This type of AI will automatically recognize patterns in data sets that might otherwise go unnoticed by humans. With machine learning, programs can become more accurate at predicting outcomes without being explicitly programmed. You have the option to pull in data from more restrictive on-premises data or draw it in from a cloud data-source or Internet. (See this tutorial on how to build a machine learning model.)
Smart Data Discovery and Visualization
Within Power BI, you can leverage four key, and extremely versatile, visualization tools all without knowing how to code. You can generate and share these visual dashboards, reports, and other interactive visualizations to derive organizational, business or market insights.
- Q&A: Natural Language Query in Power BI is a huge win. Simply type your question, and instantly get quick answers about your data. It’s that easy.
- Key Influencers: This assists you in identifying factors that drive any given metric by analyzing your data set, and then weighing the factors that matter, and finally showing them as key influencers.
- Decomposition Tree: This is a great little interactive tool for exploring and visualizing the building blocks of your data. It allows you to do ad-hoc analysis, drill down and get to the root of your values.
- Smart Narrative: The smart narrative visualization tool delivers a quick, concise text summary in plain language. It will put insights, trends and key takeaways at your fingertips.
Forecasting with Power BI
The purpose of predictive analytics is to derive insights and make predictions about future patterns and outcomes using historical data. In the past, organizations would often make decisions based on siloed data – or worse, “gut feeling.” The forecasting component integrated into Power BI brings in holistic data to drive better, more informed business decisions.
You can take advantage of the AI in Power BI to produce accurate and reliable forecasts. The AutoML algorithms constantly update and improve forecasts by bringing in new data, identifying anomalies and analyzing complex data. It enables organizations to anticipate changes within daily operations or the marketplace.
See It in Action
We wanted to demonstrate how quick and easy it is to pull together and manipulate data using Fabric with Power BI. Our development team set up a scenario to evaluate fluctuations and price changes in the real estate market.
Machine Learning: In this example, we fed the model historical data for housing prices in Washington state. This also included key influencers and parameters relating to square footage, number of bedrooms, recent renovations, prices in specific neighbourhoods, etc. With this data from 2014-2015, our program was able to learn which parts of town were more desirable, that houses with more recent renovations fetched a higher price, and that square footage and bedroom count had a direct impact on price.
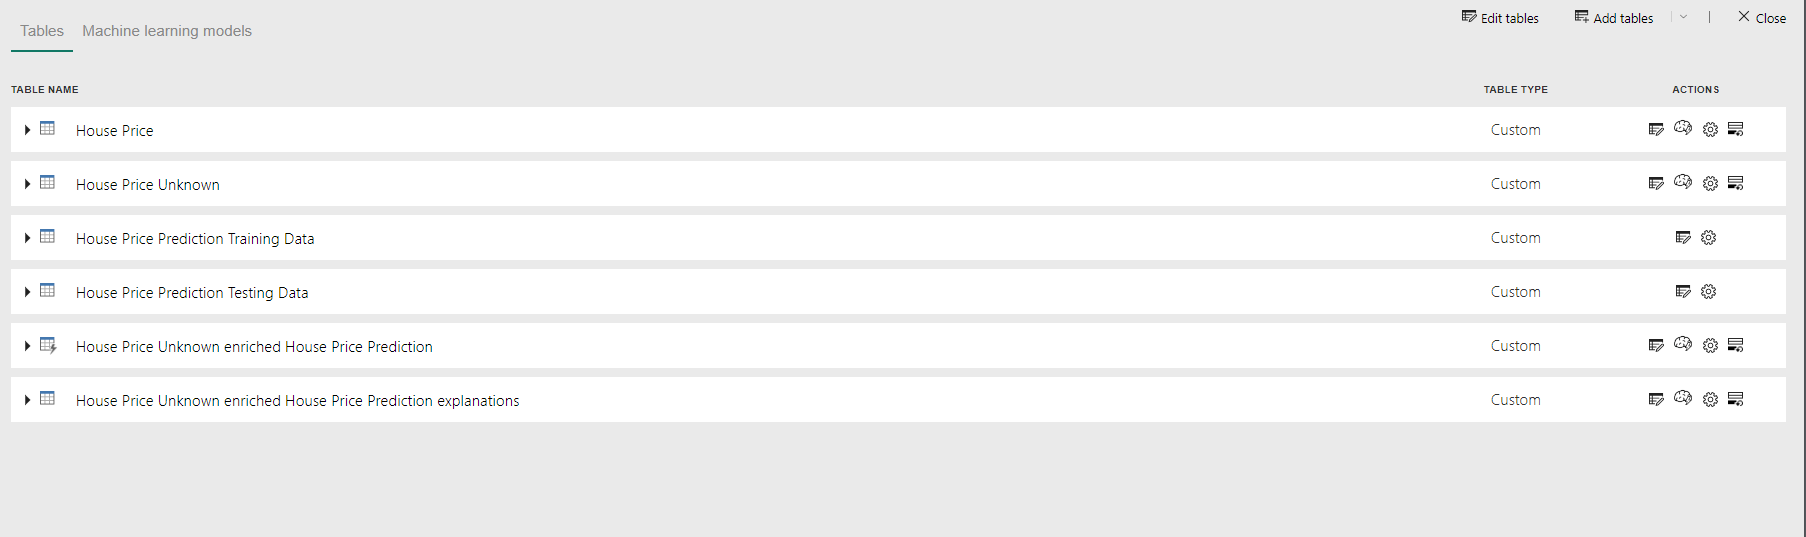
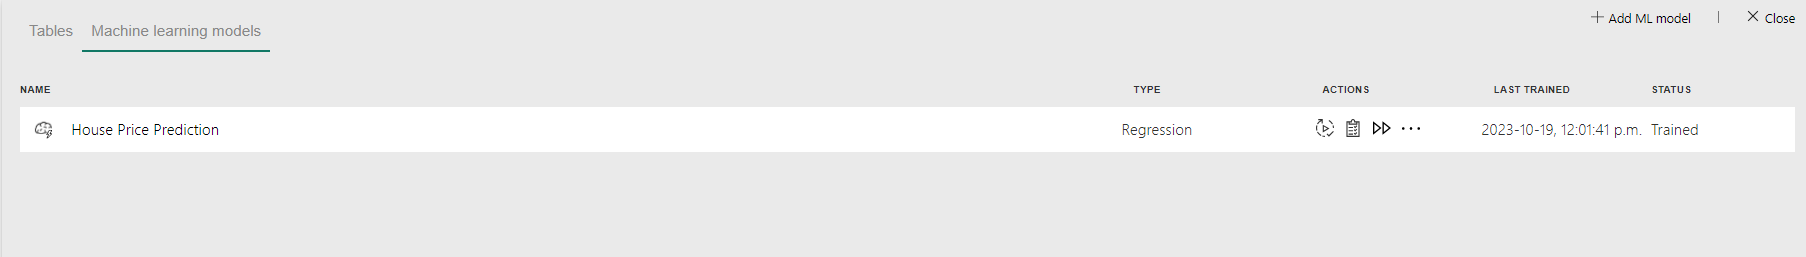
Predictive Analytics: By analyzing a single year of historical data, our model can now predict future scenarios for the 2016-2017 years ahead. Users can toggle through data based on any number of factors (like house size and location) to see how these considerations impact housing prices. The result? This is a visual dashboard stemming from the historical data that can predict how the market will fluctuate in the coming years. The map allows you to gain insights into the most expensive or least expensive housing and the factors that play into those prices. See for yourself in the demo video below.
Natural Language: One of the many user-friendly aspects of Fabric with Power BI is how you can use everyday plain language to ask the model questions. If you want to know the number of housing sales in a year, or which zip code has the highest value homes, you can just ask and get a response. See the demo video below.
While we randomly chose housing prices, these robust reports and models can be used in any industry or function – from manufacturing to marketing.
Top 3 Questions About Power BI
Our clients are curious about how Power BI works and interacts with other programs. Here are some of the questions we hear asked a lot!
What does Copilot in Power BI do?
With Copilot in the Power BI service, you can more easily combine data with generative AI to share information and create reports faster. Additionally, it can create summaries and visual narratives. (Learn more here.)
Does Power BI integrate with Dynamics 365?
Yes, it does! When you connect Power BI to your Dynamics 365 data, it enables you to get a holistic view of your business in near real time. You can also embed Power BI dashboards within Dynamics 365 to enrich reporting capabilities. By doing so, you don’t need to leave the Dynamics 365 interface to access the dashboards or reports.
Power BI integrates with Dynamics 365, SharePoint and Office 365, but does it integrate with non-Microsoft products?
Absolutely. With Power BI you can pull in data from Mailchimp, Google Analytics, Salesforce, Survey Monkey and many more. See a list of integrations here.
We are also able to create any custom integrations you might need, like we did for Lawrie Insurance Group. We built a connector between Applied Epic, a popular insurance brokerage management software, and Power BI to extract data and present it in Power BI for better analysis. Check out the case study.
Don’t Get Left Behind: Unleash the Power of AI with Power BI & Microsoft Fabric
Ready to turn your data into your most valuable asset? The future of data analytics is here, and it’s time to empower your business with the cutting-edge capabilities of Power BI and Microsoft Fabric. Don’t let the data deluge overwhelm you. Instead, seize the opportunity to harness its full potential, make informed decisions, and drive your business forward. Connect with us at Whitecap Canada to explore how we can transform your data challenges into opportunities for growth and innovation. Let’s embark on this journey together and unlock the power of your data. Contact us today to learn more and take the first step towards a data-driven future. Let’s chat.