Implementing Power BI turns raw information into data that the Lawrie Insurance Group can use for real time decision-making and management and opens new opportunities for growth.
Project
Microsoft Power BI, Application Modernization
Industry
Financial Services
Technology
Microsoft Power BI, Google Data Lake, Microsoft 365, EPIC
About
Based in Hamilton, Ontario and founded in 1982, Lawrie Insurance Group is a wholistic, multi-disciplinary and independent brokerage, providing customers with commercial insurance, personal insurance and employee benefits. The company has more than 120 employees and works with more than 60 insurance partners from around the world.
Project Impact
Time to generate month-end reports cut in half from 10 to 5 days.
10 custom dashboards allow self serve reporting, reducing ad hoc requests.
Near real-time data visibility.
The Challenge
When company controller Ji Li joined Lawrie Insurance Group, she knew there was a lot of good data locked in its business management system (BMS), Applied Epic. Unfortunately, that data wasn’t easy to extract and utilize. Business reports had to be manually generated by exporting data from Epic into Excel, which was time consuming and the kind of reporting the finance group could produce was limited.
“Our challenge was the data consumption portion. It was a serious pain point for us,” says Dave Vetuschi, Director, Information Technology, noting the technology didn’t exist previously to directly extract the data from their business management system, format it and present it for people in a clear and concise way. “It was difficult to generate reports and even then, the reports weren’t accurate, and a lot has to do with our existing BMS system.”
“I looked at all that valuable data sitting there and while we did our best through the manual process to create our reports across the company, using excel was a manual process that had so many limitations, it was not where I wanted to be,” recalled Ji Li, Lawrie Insurance Group, Corporate Controller. She knew she wanted to take advantage of those vast data stores “to create a data-driven decision-making environment” at Lawrie.
The Solution
The first step was being able to extract data from the BMS in near real time. Enhancements to Epic software finally allowed Lawrie to extract data into a data lake. Google Cloud data lake was Epic’s choice as the central repository for their data.
Next, with their data now accessible, they needed to solve the data consumption challenge. After evaluating a few options, Power BI made sense. As an organization they were already using Microsoft 365 and Power BI was included in their license.
“I did look at other companies that provided dashboard reporting tools and found that they were often just an add on to Excel. The learning curve would be less, but it wasn’t as powerful,” recalls Li, adding other cloud-based solutions would have pushed data to a third party and they weren’t as comfortable with that from a security standpoint.
With the decision to use Power BI made, they needed a technology partner to help them customize the solution to meet reporting needs to help Li turn Lawrie into the data driven organization she envisioned. Lawrie was looking for a flexible, collaborative partner. Someone who could be an extension of their team. After a competitive process, Lawrie chose to work with Whitecap to help them take the next step in their digital evolution to become a data driven organization.
I’ve heard the saying Power BI is just Excel on steroids but that’s false. It gives me a whole different way of looking at my overall financial analysis and business intelligence. I see huge potential for the way we can use the tools and what I can do next to organize my data.
Corporate Controller, Lawrie Insurance Group
We are now able to make use of this data consumption tool to the point we are squeezing even more ROI out of our system. Everyone got a taste of it and they like what they are tasting but we’ve only just stuck our foot in the door of what’s possible.
Director, Information Technology, Lawrie Insurance Group
Data Driven Decision-Making
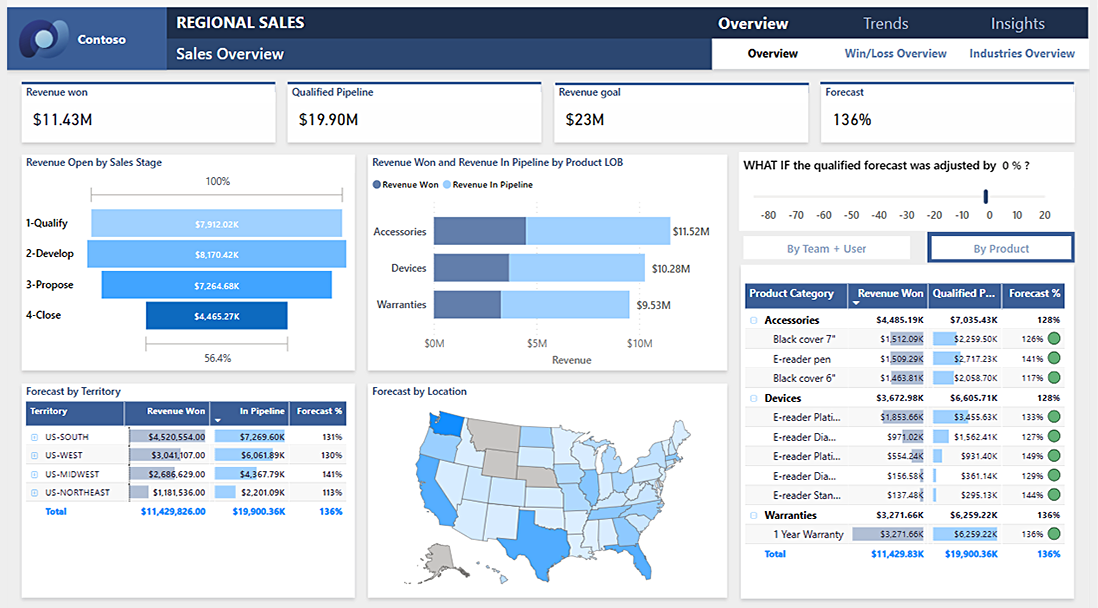
Consolidating all their data into useable financial reporting dashboards was a top priority for Li. Working with Whitecap, they mapped the data and worked together to create a range of standard reports. After seeing the possibilities and rapid development capabilities of Power BI, combined with the agile, collaborative way of working with Whitecap, the scope of the project quickly expanded.
With Whitecap’s help, Li was able to roll out 10 report dashboards, including four for production and sales, and six for finance. Whitecap has also helped document the dashboard and data mapping process, as well as train Lawrie staff so they have greater control over the data and dashboard creation process.
With the data now readily accessible, reporting has been accelerated. Li says that in the past, month-end closing would take two people about 10 days. Now, staff can close month end and develop reports in five days.
“Our managers and C-suite are happy with the results,” says Li. “From my end I achieved my vision. I have showed people how powerful data is, and how easy it can be to get.”
“It’s really improved our efficiency, but it’s also delivering business intelligence to decision-makers quicker and more accurately.”
Dashboard Data Visibility
The move to Power BI has also put data in the hands of decision-makers. Instead of calling finance every time they needed a report, the standard dashboards created by Whitecap let Lawrie executives see relevant KPIs any time they want.
“It is self service. They have access to dashboards with near real time visibility so that really saves time,” says Li, noting one report that was often needed used to take her team a day to pull together. It’s now on the Power BI dashboard so it can be viewed any time.
The internal management team is already seeing the benefits. During a year end review, the manager was able to pull up a producer’s market, growth, trends and have a more meaningful discussion. This really showcased how powerful having accurate data at your fingertips can be.
Li adds that Whitecap’s team worked hard to understand what data they were trying to present, and to look to the future so their reports and dashboards could more easily scale. She also notes Whitecap was very good at helping them present that data in a user-friendly way.
This is for us a very much a data consumption project. We have our data in our BMS system, but it is difficult to do data consumption from our existing BMS. There is so much data there, this is a very simplistic way to consume our data in a useful way, very strategically and very purposefully.
Director, Information Technology, Lawrie Insurance Group
Future Projects & Enhancements
As the team at Lawrie gets accustomed to the vast number of reports they now have at their fingertips, Li says they are looking to extend some dashboards to other levels of the organization, such as sales.
In addition, the Power BI engagement has been so successful, Lawrie is working with Whitecap on a SharePoint project to create a useful, user-friendly intranet site that helps deliver corporate information and material to internal users.
I was impressed with their engagement (during vendor selection). Whitecap is very responsive and really stands out. When it comes to professionalism, knowledge and responsiveness, I felt Whitecap proved they are very good at all those things.
Corporate Controller, Lawrie Insurance Group